Python 的多項式曲線擬合
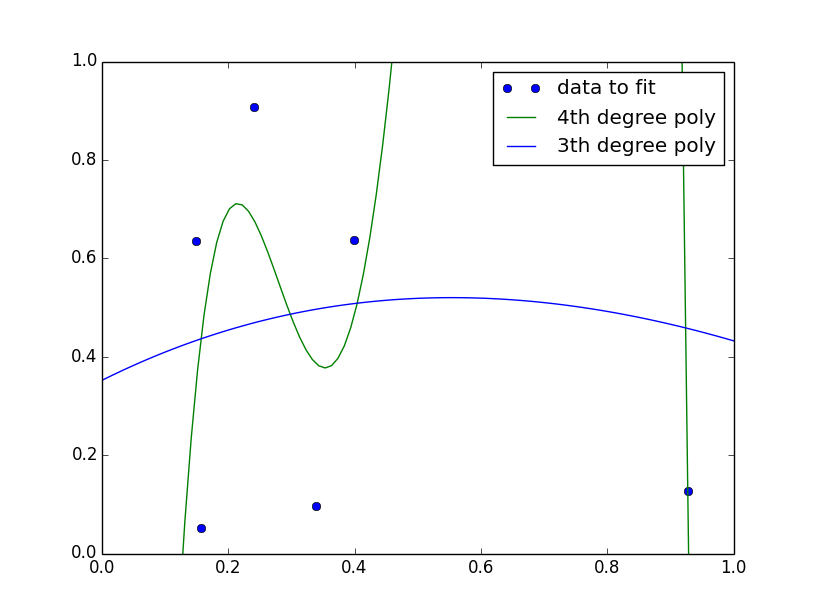
import numpy as np import pylab as plt # 隨機產生資料點來Fit x = np.random . rand ( 7 ) y = np.random . rand ( 7 ) # 最高次項為4次方的多項式 line4 = polyfit ( x , y , 4 ) pn4 = poly1d ( line4 ) line3 = polyfit ( x , y , 3 ) # 最高次項為3次方的多項式 pn3 = poly1d ( line3 ) xaxis = linspace ( 0 , 1 , 100 ) plt . plot ( x , y , 'o' , xaxis , pn4 ( xaxis ), '-g' , xaxis , pn3 ( xaxis ), '-b' ) plt . legend ([ 'data to fit' , '4th degree poly' , '3th degree poly' ]) plt . axis ([ 0 , 1 , 0 , 1 ]) plt . show () 再提高次方數可以擬合的更好,點到即止。